Scope 3 waste emissions, known as Category 5 under the GHG Protocol, are the indirect greenhouse gases released when third parties treat or dispose of the solid waste and wastewater your operations generate. Getting the number right depends on which calculation method you choose: supplier-specific, waste-type-specific or average-data, each with its own accuracy and audit trail.
TL;DR:
- Category 5 covers third party treatment of operational waste, while supplier process waste belongs in Category 1; landfill emissions count in the year generated.
- Use contractor reported emissions when available; otherwise match factors to each waste type and treatment route, documenting uncertainty when averages are necessary.
- On site waste treatment belongs in Scope 1; exclude waste to energy combustion from Category 5 when the resulting electricity is counted in Scope 2.
- Divert food waste from landfill to composting or anaerobic digestion, and report avoided emissions from recycling separately rather than netting them against gross totals.
- Under EU sustainability reporting rules, explain any omitted Scope 3 category transparently; temporary omission relief is conditional and time limited, not a permanent exemption.
Table of Contents
- Category 5: scope, time boundary and material treatment routes
- Calculation methods and the activity data you need
- Accounting boundaries and common pitfalls to avoid
- Reporting and materiality: expectations from ESRS, CSRD and investor audiences
- Practical steps to measure better and reduce Category 5 emissions
- Practitioner perspective: why better Category 5 data changes decisions
- A free audit and bale buyback that put real data behind your Category 5 numbers
- FAQ
- Sources
- Key primary sources to consult for technical methods and regulatory expectations
Category 5: scope, time boundary and material treatment routes
The GHG Protocol defines Category 5 as covering third-party treatment and disposal of both solid waste and wastewater generated in your own operations, not waste tied to purchased goods or downstream products. That distinction matters when you are scoping an inventory: waste from your offices, warehouses and production lines belongs here, while waste embedded in a supplier’s manufacturing process sits in Category 1.
The time boundary trips up a lot of reporting teams. Category 5 accounts for emissions that will occur in the future from waste generated during this reporting year, so a tonne of food waste sent to landfill during a reporting year is counted against that reporting year even though methane will keep venting for years afterwards. That forward-looking boundary is why landfill diversion decisions made today show up immediately in your inventory rather than waiting for the gas to materialise.
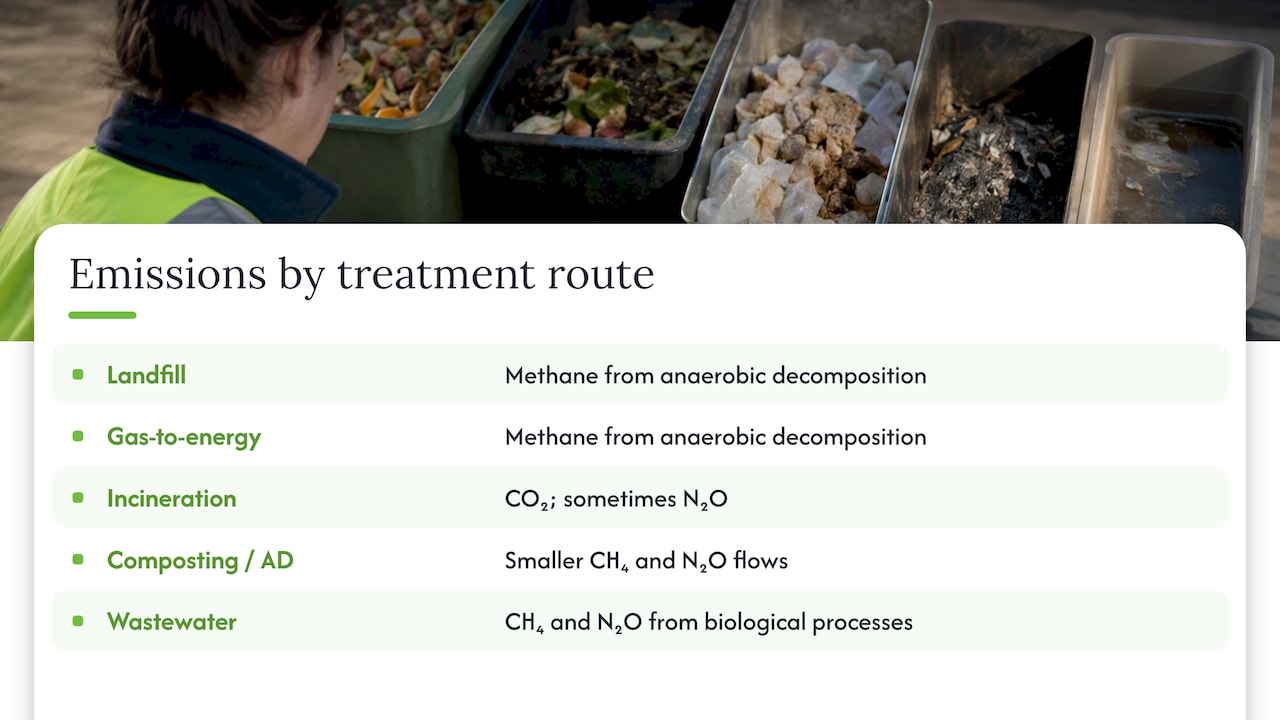
Treatment routes shape which gases dominate. Landfill and landfill with gas-to-energy recovery produce methane as organic waste decomposes anaerobically; incineration releases carbon dioxide, and sometimes nitrous oxide, depending on waste composition and energy recovery; composting and anaerobic digestion generate smaller methane and nitrous oxide flows; wastewater treatment contributes methane and nitrous oxide from biological processes. The waste sector overall accounts for under 5% of global emissions, with landfill methane and wastewater methane and nitrous oxide as the largest sources.
Calculation methods and the activity data you need
Three methods cover Category 5 calculations, and the right one depends on what your waste contractors can actually give you.
The supplier-specific method uses emissions data reported directly by your waste treatment suppliers, covering their own Scope 1 and Scope 2 output for the specific waste they process on your behalf. This is the most accurate approach and the GHG Protocol recommends it where waste volumes are material and your supplier relationship allows for data sharing, since it reflects the actual treatment technology and efficiency rather than an industry average.
The waste-type-specific method disaggregates your waste stream by category, cardboard, food, plastic, wastewater and applies an emission factor matched to the treatment route each type goes through. It is more work than a blended average but considerably more defensible when your waste mix varies by site or season.
The average-data method is the fallback when supplier or waste-type data is not available. It multiplies total waste mass by the proportion sent to each treatment route, then by an emission factor for that route, and it carries the highest uncertainty of the three methods because it leans on sector-wide averages rather than your actual operations.
Whichever method you use, the activity data checklist looks the same:
- Total waste mass in tonnes, broken down by waste type.
- The proportion of each waste type sent to landfill, incineration, recycling, composting, anaerobic digestion or wastewater treatment.
- Supplier-reported emissions data where your contractor can provide it.
- Biochemical oxygen demand or chemical oxygen demand figures for wastewater streams.
Document the uncertainty attached to whichever method you settle on. A supplier-specific figure needs far less caveating in a disclosure than an average-data estimate, and reviewers and assurance providers will expect that distinction to be visible.
Accounting boundaries and common pitfalls to avoid
Most Category 5 errors come from boundary confusion rather than bad data. The first question to settle is whether treatment happens on site or through a third party: waste you treat yourself, say with your own compactor or an on-site wastewater plant, falls under your direct operational control and belongs in Scope 1, not Scope 3.
Waste-to-energy facilities are the second common trap. The GHG Protocol is explicit that you should only count emissions from preparing and transporting waste to these facilities in Category 5; the combustion emissions themselves are typically already captured in Scope 2 by whoever purchases the resulting electricity, so counting them again in your inventory double counts the same tonne of carbon.
Transport of waste sits in a grey area: it can be reported under Category 4 (upstream transportation) or, optionally, folded into Category 5 reporting alongside the waste itself. Pick one approach and stay consistent across reporting years.
- Confirm treatment ownership before classifying anything as Scope 1 or Scope 3.
- Exclude combustion emissions already counted elsewhere when using waste-to-energy routes.
- Flag every use of an average emission factor and note where supplier-specific data would improve it.
Pro Tip: Keep a running decision log for every boundary judgement call and a separate supplier engagement log, so an auditor can trace exactly why a tonne of waste landed where it did.
Reporting and materiality: expectations from ESRS, CSRD and investor audiences
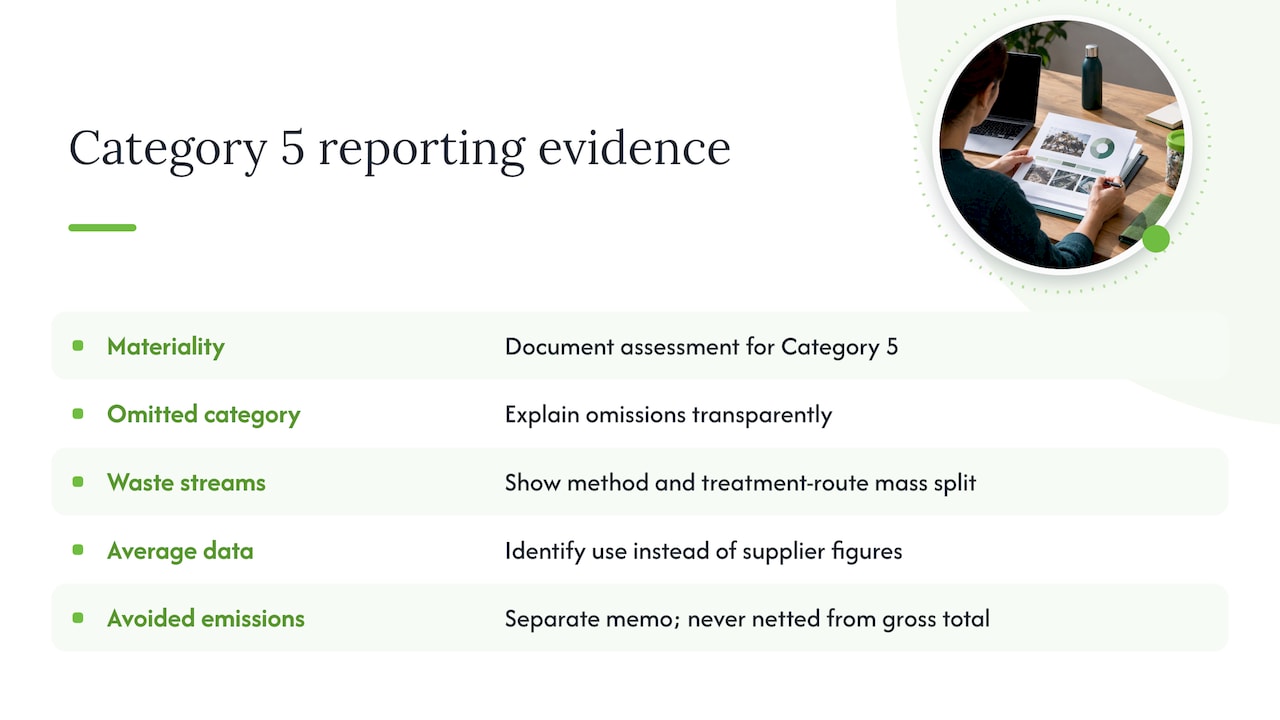
EU sustainability reporting now expects a rigorous, documented materiality assessment behind every disclosed topic, Category 5 included. The Platform on Sustainable Finance has flagged that companies need clearer guidance to carry out these assessments consistently, and that any decision to omit a Scope 3 category must come with a transparent explanation rather than a silent gap. Some undertakings have temporary derogations allowing limited omissions under the amended delegated act, but that relief is conditional and time-limited, not a permanent exemption.
What investors and assurance providers actually want to see is the working behind the number: which calculation method you used for each waste stream, how waste mass was split across treatment routes, and where you have relied on average data rather than supplier figures. Avoided emissions from recycling or diversion should be reported as a separate memo item, never netted off against your gross Category 5 total, since blending the two obscures the real scale of waste generated.
Stronger Category 5 data does more than satisfy a checkbox. It gives assurance providers a clear audit trail, gives your sustainability team a defensible position when investors ask follow-up questions, and makes it far easier to show genuine year-on-year progress rather than a number that moved because the calculation method changed.
Practical steps to measure better and reduce Category 5 emissions
Improving your Category 5 figure is largely an operational exercise before it is a reporting one.
- Commission a targeted waste audit to establish exactly how much waste you generate by type and where each stream currently goes, landfill, recycling, composting or incineration.
- Engage your waste treatment suppliers directly for their emissions data, or, where that is not available, source treatment-specific emission factors rather than defaulting to generic averages.
- Shift diversion where it reduces methane most: moving food waste from landfill into anaerobic digestion or composting cuts the single largest source of waste-sector emissions, and tracking the change in treatment proportions over time shows the effect in your inventory.
- Report supplementary metrics alongside your headline figure, recycling emissions compared with virgin material production, or energy-from-waste intensity, so decision-makers can see where the real leverage sits rather than just the total.
A well-run bale buyback or material recovery programme does double duty here: it improves your diversion rate away from landfill, and it generates exactly the kind of auditable mass and destination record that a waste-type-specific calculation needs.
Practitioner perspective: why better Category 5 data changes decisions
Accurate Category 5 figures change the conversation with investors because vague estimates invite scrutiny while documented mass flows and supplier data do not. In practice, the organisations that commission a proper waste audit and start tracking diversion by waste type tend to find the same thing: better data surfaces recoverable material they were previously paying to bury, turning a reporting exercise into a revenue line.
— Graham
A free audit and bale buyback that put real data behind your Category 5 numbers
We run a free waste audit that maps exactly where your waste mass goes today, landfill, recycling, composting or elsewhere, giving you the waste-type-specific activity data a credible Category 5 calculation needs rather than a sector-wide average. We also buy back your cardboard and plastic bales, which means every diverted tonne generates both a measurable destination record for your inventory and a direct payment rather than a disposal cost.
- A free waste audit that quantifies waste mass by type and current treatment routes.
- A bale buyback scheme that converts recyclable cardboard and plastic into revenue while producing auditable mass data.
- A waste audit checklist you can use to start collecting the activity data your reporting team needs now.
If your reporting cycle is approaching and your Category 5 figure still rests on generic averages, booking a free waste audit is the fastest way to replace that estimate with numbers you can actually defend.
FAQ
How many categories are in Scope 3 emissions?
Scope 3 has 15 categories under the GHG Protocol, covering everything from purchased goods and capital goods to business travel, waste generated in operations and end-of-life treatment of sold products. Waste generated in operations is Category 5, and a playbook for tracking all 15 categories can help teams building out a full inventory.
What are the different types of carbon footprints?
Carbon footprints are usually organised around Scope 1 (direct emissions from owned sources), Scope 2 (emissions from purchased energy) and Scope 3 (indirect emissions across the value chain, including waste, purchased goods and transport). A life-cycle approach that prioritises prevention and material recovery, as the Ellen MacArthur Foundation sets out, also shapes how organisations frame their footprint beyond the three-scope model.
How do you reduce Scope 3 emissions?
Reducing Scope 3 emissions starts with accurate measurement, since you cannot cut what you have not quantified, followed by targeted action such as diverting waste from landfill, engaging suppliers for better emissions data and redesigning packaging to use more recycled or recyclable material. For packaging specifically, strategies that cut packaging-related carbon complement waste-stream diversion efforts.
What are Scope 3 emissions versus Scope 2 emissions?
Scope 2 covers emissions from electricity, heat or steam your organisation purchases and consumes directly, while Scope 3 covers everything else in your value chain, including waste treatment, business travel and emissions embedded in purchased goods. Category 5 waste emissions sit in Scope 3 because the treatment and disposal happen at a third-party facility, not on your own site.
Sources
- Category 5:
- Response of the Platform on Sustainable Finance to the call for feedback on the draft European Sustainability Reporting Standards (ESRS) Delegated Act
- Waste Management